So, you’ve come this far in your journey—bravo!
Before we dive into real-life scenarios with JSON/XML and API requests, let’s take a quick pause to set the stage. Understanding data types is key to making sense of how APIs work and communicate. Think of this chapter as a quick detour—a fun, visual pit stop to explore the personalities of data types and how they show up in APIs.
Don’t worry—this isn’t as technical as it sounds! Data types are like characters in a story, each with its own role and style. Some are straightforward (like the “Yes or No” types), while others love details. Our goal? To help you visualize them so you’re ready to tackle real-world scenarios with confidence. Let’s dive in!
Boolean Data Type: The Binary Gatekeeper
Meet Boolean, the straightforward sentinel of the data world. This type operates on a simple principle: it’s either true or false, much like a light switch—on or off. Boolean values are common in API requests and responses for toggle features and status indicators.
Visual Representation:
- Checkbox: Checked for
true, unchecked forfalse. - Toggle Switch: Flipped on for
true, off forfalse.
Example in UI:
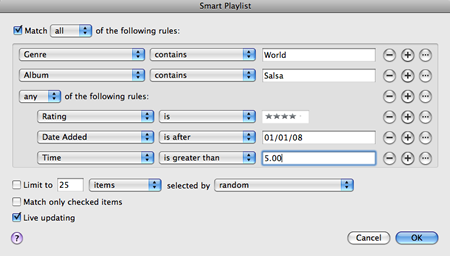
- Should live updates be enabled? ✅ Yes! Check the box. ❌ No? Leave it empty.
Imagine a checkbox labeled “Enable Dark Mode.” If it’s checked, your interface dons a sleek, dark theme. If not, it stays light and bright.
String Data Type: The Textual Storyteller
Next up is String, the data type that loves to express itself through text. From names and addresses to entire paragraphs, Strings are the chatterboxes of the data family. In API documentation, strings often represent names, descriptions, and other text-based information.
Visual Representation:
- Single-line Text Field: Ideal for short inputs like usernames.
- Multi-line Text Area: Perfect for longer entries like comments or descriptions.
Example in UI:
- Username: [______]
Picture a text box prompting you to enter your “Favorite Quote.” That’s String inviting you to share some wisdom.
Number Data Type: The Numerical Navigator
Say hello to Number, the data type that quantifies the world. Whether it’s age, price, or quantity, Numbers are all about digits. APIs frequently use numbers for IDs, quantities, and measurements.
Visual Representation:
- Stepper: Buttons to increment or decrement a value.
- Slider: A bar to select a value within a range.
Example in UI:
- Select Quantity: [-] 1 [+]
Visualize a product page where you choose the number of items to purchase using plus and minus buttons. That’s Number at work.
List (Array) Data Type: The Organized Ensemble
Enter List, also known as an Array. This type is like a well-curated playlist, holding multiple items in a specific order. In JSON, arrays are represented with square brackets [] and are essential for collections of data.
Visual Representation:
- Dropdown Menu: Select one option from a list.
- Multi-select List: Choose multiple options.
Example in UI:
- Choose Your Interests: [ ] Music [ ] Sports [ ] Art
Imagine a survey asking you to select your hobbies from a list of checkboxes. Each tick adds to the List.
Date and Time Data Type: The Temporal Tracker
Meet Date and Time, the schedulers of the data world. They keep track of when events occur. APIs often use standardized formats like ISO 8601 (YYYY-MM-DD) for dates.
Visual Representation:
- Calendar Picker: Select a specific date.
- Time Picker: Choose a specific time.
Example in UI:
- Appointment Date: [📅]
Think of booking a flight and selecting your departure date from a calendar. That’s Date and Time guiding your journey.
Enum Data Type: The Exclusive Selector
Last but not least, Enum (short for Enumeration) represents a set of predefined values. It’s like choosing your character class in a game—you have specific options. In REST APIs, enums often define allowed values for parameters.
Visual Representation:
- Radio Buttons: Select one option from a few.
- Dropdown Menu: For longer lists of options.
Example in UI:
- Select Gender: ( ) Male ( ) Female ( ) Other
Imagine setting your user profile and selecting your country from a dropdown list. That’s Enum in action.
Common Data Type Visualization Problems and Solutions
| Problem | Symptom | Solution |
|---|---|---|
| Boolean confusion | Users unsure if checkbox means "true" when checked or unchecked | Add clear labels next to checkbox (e.g., "Enable feature") |
| String length uncertainty | Users not knowing maximum character limits | Add visible character counters or length indicators |
| Number range ambiguity | Users entering invalid numeric values | Use sliders with visible min/max or add validation messages |
| List selection limitations | Users trying to select multiple items in single-select lists | Clearly indicate if multiple selection is allowed with "Select one" or "Select multiple" labels |
| Date format inconsistency | Users entering dates in various formats | Use calendar pickers instead of free text input for dates |
| Enum selection clarity | Users not understanding limited options | Use radio buttons for small sets of options with clear labels |
| Complex nested data display | Users confused by hierarchical data structure | Use expandable sections, tree views, or tabbed interfaces |
Data Types in API Documentation: Making the Abstract Concrete
By visualizing these data types with familiar UI elements, we bridge the gap between abstract concepts and practical understanding. As you document APIs, associating data types with their visual counterparts can make the information more accessible and engaging for your audience.
When writing API documentation, it’s important to clearly indicate the data type for each parameter and response field. This helps developers understand:
- What kind of data to send
- What format the API expects
- How to validate user input
- What to expect in the response
Remember, each data type has its own personality and role in the digital narrative. Embrace them, and you’ll be well on your way to mastering API documentation with confidence and clarity.
Frequently Asked Questions About Data Type Visualization
Get answers to common questions about visualizing different data types in APIs and user interfaces.
Data Type Basics
Data types in APIs are classifications that define what kind of value a variable can hold. Common API data types include Boolean, String, Number, List/Array, Date/Time, and Enum. Understanding data types is essential for properly formatting API requests and interpreting responses.
Visualizing data types helps bridge the gap between abstract programming concepts and user understanding. It makes documentation more accessible, especially for visual learners and non-developers. Effective visualization can reduce misunderstandings, improve developer experience, and speed up API integration.
JSON and XML are data interchange formats that represent the various data types in structured ways. In JSON, data types are represented as strings, numbers, booleans, arrays, objects, or null. XML similarly represents these types but uses elements, attributes, and specific formatting. Understanding these representations is crucial for parsing API responses correctly.
Visualization Techniques
Boolean data types (true/false) are most effectively visualized using checkboxes or toggle switches. Checkboxes are universally recognized—checked for true, unchecked for false. Toggle switches provide a more modern interface with a clear on/off visual representation.
String data types are best represented with text input fields. Single-line text fields work well for short inputs like names or IDs, while multi-line text areas are appropriate for longer text like descriptions or comments. The field size should visually suggest the expected length.
Number data types can be effectively visualized with numeric steppers (with increment/decrement buttons), sliders for value ranges, or specialized number input fields. For finite ranges, sliders provide visual feedback about where a value sits within the possible range.
Lists or Arrays are typically visualized using dropdown menus, multi-select boxes, or a series of checkboxes. For ordered lists, numbered items or drag-and-drop interfaces can emphasize the sequence. Tags or chips work well for displaying multiple selected items in a compact form.
Special Data Types
Date and Time data types are best represented with calendar pickers and time selectors. These provide a user-friendly way to input standardized date formats without requiring users to remember specific formatting rules. For recurring dates, specialized UI components like date range pickers or schedule selectors may be more appropriate.
Enum data types work best with radio buttons (for few options) or dropdown menus (for many options). These UI elements make it clear that only one option can be selected from a predefined set of values. Color-coding or icons can enhance the visual distinction between options.
Complex or nested data structures can be visualized using expandable/collapsible sections, tree views, or tabbed interfaces. Interactive JSON/XML viewers with syntax highlighting and collapsible nodes help users navigate and understand the hierarchy of nested data. Visual diagrams showing relationships between data elements can also be helpful.
Implementation Considerations
Responsive design principles apply to data type visualizations. On smaller screens, certain elements may need to adapt—dropdown menus might replace radio buttons, date pickers may simplify, and complex visualizations might require progressive disclosure. Always test visualizations across various device sizes to ensure usability.
Accessibility is crucial for data type visualizations. Ensure proper contrast, support keyboard navigation, provide text alternatives for visual elements, use ARIA labels, and ensure screen reader compatibility. Form elements should have clear labels and error messaging. Follow WCAG guidelines to make visualizations accessible to all users.
Design systems can create consistent component libraries with standardized UI elements for each data type. This ensures consistency across an API platform and speeds up documentation creation. The system should include guidelines for when to use each visualization type, along with code snippets or components that can be easily implemented.
Key Takeaways
- Boolean data types (true/false) are best visualized with checkboxes or toggles
- String data types (text) appear as text fields or text areas in user interfaces
- Number data types work well with steppers, spinners, or sliders
- List/Array data types are typically displayed as dropdowns or multi-select components
- Date and Time data types are represented with calendar pickers and time selectors
- Enum data types work best with radio buttons or dropdown menus
- Visualizing data types helps bridge the gap between technical concepts and user understanding
You’ve done an incredible job exploring the personalities of data types and how they come to life in APIs. Now that you’ve got a clear picture of Boolean, String, Number, and their friends, you’re ready to see them in action.
In the next chapter, we’ll take all this knowledge and dive into real-life scenarios of API documentation. You’ll see how these data types fit into actual API requests and responses, making your understanding even more practical and hands-on.
Get excited—it’s time to connect the dots and bring your API documentation journey to the next level. See you there!
Test Your Knowledge

Data Type Resources
Expand your understanding of data types with these carefully selected resources.